Journal quartiles (Q1–Q4) are among the most widely used indicators for evaluating scientific journals. Researchers often rely on quartile classifications when selecting publication venues, assessing research performance, or comparing journals across bibliometric databases. However, confusion frequently arises when percentile values are compared between different ranking systems. A journal classified as Q1 in one database may be reported around the 75th percentile, whereas the same journal in another database may appear around the 25th percentile. At first glance, these values seem contradictory. How can the same journal simultaneously belong to both the 25th and the 75th percentile?
The answer lies in the definition of percentile rank rather than in the journal itself.
Many researchers intuitively regard a percentile as an absolute measure of performance. In reality, a percentile is simply a way of expressing the position of an item within an ordered list. Like measuring distance from either end of a road, the numerical value depends on where the counting begins. Consequently, different percentile definitions may assign different numerical values to the same journal while preserving exactly the same ranking.
To illustrate this concept, consider a subject category containing one hundred journals ranked according to any bibliometric indicator, such as Impact Factor, CiteScore, SJR, or SNIP. The ranking itself is identical regardless of the database used.
| Journal | Rank | Quartile |
|---|---|---|
| A | 1 | Q1 |
| B | 25 | Q1 |
| C | 50 | Q2 |
| D | 75 | Q3 |
| E | 100 | Q4 |
The ranking shown above is fixed. Every database agrees that Journal A is the highest-ranked journal and Journal E is the lowest-ranked journal. The only difference lies in how percentile values are assigned.
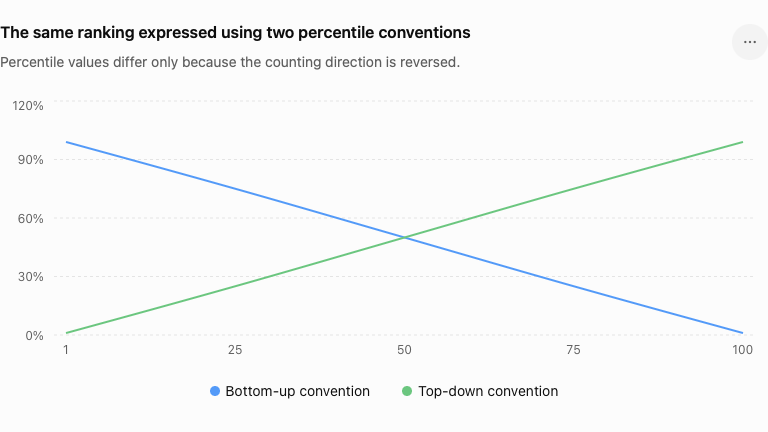
One common approach calculates percentile rank from the bottom of the ranking. Under this definition, the percentile represents the percentage of journals that a journal outperforms. Consequently, the highest-ranked journal receives a percentile close to 100, whereas the lowest-ranked journal receives a percentile close to zero. In this system, journals belonging to Q1 typically have percentile values between 75 and 100.
Another approach calculates percentile rank from the top of the ranking. Under this definition, the highest-ranked journal receives the smallest percentile value, while the lowest-ranked journal receives the largest percentile value. Consequently, Q1 journals typically have percentile values between 0 and 25.
Although these percentile values appear very different, they describe exactly the same ranking.
The comparison is illustrated in Figure 1.
Figure 1. Percentile values obtained using two different counting conventions. The curves are mirror images of one another. Although percentile values differ, the journal ranking and quartile classification remain exactly the same.
The relationship becomes even clearer when individual journals are compared.
| Journal | Rank | Bottom-up Percentile | Top-down Percentile | Quartile |
|---|---|---|---|---|
| A | 5 | 95 | 5 | Q1 |
| B | 20 | 80 | 20 | Q1 |
| C | 35 | 65 | 35 | Q2 |
| D | 60 | 40 | 60 | Q3 |
| E | 90 | 10 | 90 | Q4 |
Notice that every journal keeps exactly the same rank and quartile regardless of the percentile definition. Only the numerical percentile changes because the reference direction has been reversed.
An everyday analogy helps explain this phenomenon. Imagine a straight road that is exactly 100 km long. A town located 30 km from the western end is simultaneously located 70 km from the eastern end. Both measurements are correct because they use different starting points. Likewise, a journal reported as being in the 75th percentile in one database may legitimately be reported as being in the 25th percentile in another database. The journal has not changed; only the reference point used for measurement has changed.
This distinction also explains why statements such as
- “Q1 consists of the top 25% of journals,”
- “Q1 begins at the 75th percentile,” and
- “Q1 begins at the 25th percentile”
can all be correct. The first statement describes the proportion of journals included in Q1. The second uses a percentile measured upward from the bottom of the ranking, whereas the third uses a percentile measured downward from the top. These statements are different numerical descriptions of exactly the same set of journals.
From a mathematical perspective, the two percentile systems differ only by the direction of counting. They preserve the relative ordering of journals and therefore always produce identical quartile classifications. Consequently, the apparent disagreement between the 25th and the 75th percentile is purely a matter of notation rather than a difference in journal quality.
In practice, however, the bottom-up convention is often more intuitive because it directly expresses the proportion of journals that a journal outperforms. For example, describing a journal as being in the 75th percentile immediately conveys that it performs better than approximately 75% of journals within the same subject category. This interpretation is consistent with the common understanding of percentile rank in educational testing, statistics, and many performance evaluation systems. For this reason, numerous bibliometric databases and ranking systems prefer the bottom-up convention when reporting percentile values.
Ultimately, percentile values should never be interpreted without considering how they are defined. Researchers should avoid comparing numerical percentile values across databases unless the underlying percentile conventions are identical. Instead, attention should be directed to the journal’s relative position within the ranked population. Once the definition is understood, the apparent contradiction between the 25th and the 75th percentile disappears: both values describe exactly the same journal standing using different reference directions.